
LiFePO4 battery cycle life is the single most quoted number in energy storage procurement — and the least standardised. A datasheet that says “8,000 cycles” tells you almost nothing on its own, because the same cell can be honestly rated at 3,500 cycles or 10,000 cycles depending on the temperature, depth of discharge, current rate and end-of-life threshold used in the test. If two suppliers quote you different numbers, the difference is usually in the test conditions, not in the hardware.
This guide gives you the seven checks that separate a verifiable cycle life claim from a marketing number. It is written for distributors, solar installers, EPC contractors and OEM buyers who have to defend a battery selection to a customer or a project owner.
Short answer: a cycle life figure is only meaningful when it is stated together with test temperature, depth of discharge, charge/discharge rate, end-of-life capacity threshold, whether it was measured at cell or pack level, and which standard the test followed. If any of those six are missing, treat the number as unverified.
What Does LiFePO4 Battery Cycle Life Actually Measure?
LiFePO4 battery cycle life is the number of full charge–discharge cycles a battery can complete before its usable capacity falls to a defined percentage of its original rated capacity — commonly 80%, sometimes 70%.
Three things follow from that definition, and all three are routinely lost in translation between a test lab and a product page.
It is a capacity-fade metric, not a failure metric. A battery that has reached “end of cycle life” has not stopped working. An LFP pack at 80% capacity retention still charges, still discharges, still communicates with the inverter — it simply stores 20% less energy than the day it was commissioned. For a residential backup system that was oversized at design time, this may be a non-event. For a commercial peak-shaving system sized tightly against a demand charge, it can break the financial model in year eight.
It is defined against a threshold that the supplier chooses. Moving the end-of-life threshold from 80% to 70% capacity retention can add 25–40% to the headline cycle count without changing a single component. Both figures can be technically accurate. Only one is comparable to your other quotes.
It is almost always extrapolated. This is the point most buyers miss, so it gets its own section below.
Related reading: LiFePO4 cell voltage and state of charge · How to size a home battery system
[IMAGE: comparison chart showing capacity retention curves at different DOD levels — alt: “LiFePO4 battery cycle life curves comparing 100%, 80% and 50% depth of discharge”]
Why 6,000 and 8,000 Cycle Claims Are Not Comparable
Consider a single LiFePO4 cell — one real cell, one real chemistry, tested honestly in six different ways:
| Test conditions | Typical result |
|---|---|
| 25°C, 50% DOD, 0.2C, EOL at 80% | 10,000+ cycles |
| 25°C, 80% DOD, 0.2C, EOL at 80% | ~6,000 cycles |
| 25°C, 80% DOD, 0.5C, EOL at 80% | ~5,000 cycles |
| 25°C, 100% DOD, 0.5C, EOL at 80% | ~3,500 cycles |
| 45°C, 80% DOD, 0.5C, EOL at 80% | ~3,000 cycles |
| 25°C, 80% DOD, 0.2C, EOL at 70% | ~8,000 cycles |
Every row is defensible. A supplier who publishes the first row and a supplier who publishes the fifth row may be selling the same cell from the same factory. The one quoting 10,000 cycles is not lying; they have simply chosen the most favourable test envelope and omitted the conditions.
This is why a like-for-like comparison between two quotes is impossible unless you normalise the conditions first. The seven checks below are how you do that.
Procurement rule of thumb: if a datasheet gives a cycle count without a temperature, a DOD and a C-rate on the same line, the number is not a specification. It is a headline.
The 7 Checks
1. Test temperature — 25°C or 45°C?
Temperature is the strongest single variable in lithium iron phosphate ageing. Most published cycle life figures are measured at 25°C ± 5°C, which is a laboratory condition, not a field condition.
Ageing in lithium cells follows an approximately Arrhenius relationship: the rate of the side reactions that consume lithium inventory roughly doubles for every 10°C rise. In practice, cycling an LFP pack at a sustained 45°C rather than 25°C can remove 40–50% of its cycle life.
What to ask: “At what ambient temperature was the cycle test run, and was the cell surface temperature logged?”
Why it matters for your project: a rack of batteries in an unventilated equipment room in Queensland, Andalusia or the Gulf will not see 25°C. If the site conditions are hot, ask the supplier for a derating curve — a real manufacturer will have one. If they do not, that tells you something.
2. Depth of discharge — 80%, 90% or 100%?
Depth of discharge (DOD) defines how much of the rated capacity is used in each cycle. Shallower cycling means less mechanical and chemical stress per cycle, and dramatically more cycles.
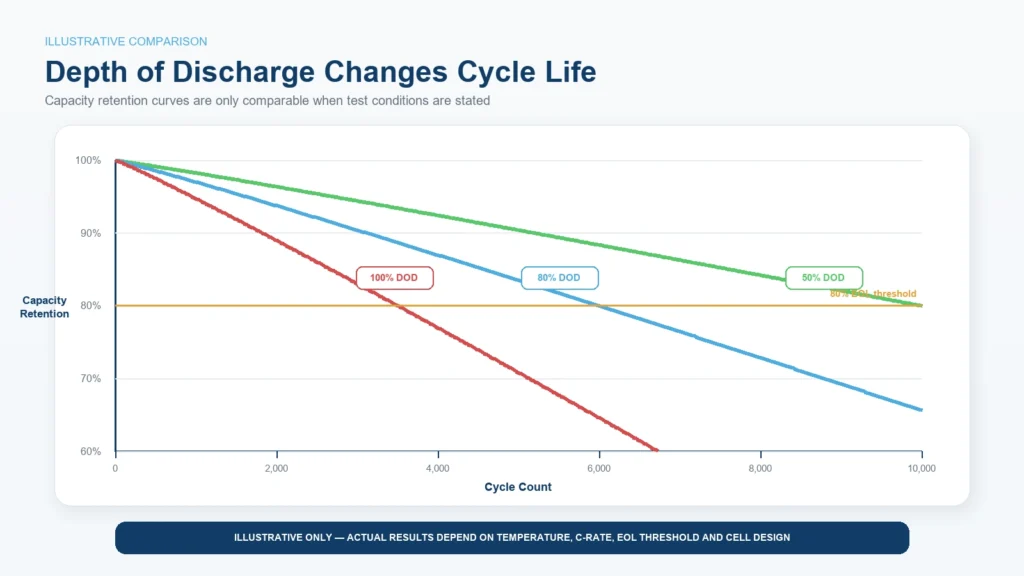
The industry convention for stationary LiFePO4 storage is 80% DOD, and that is the figure you should insist on for comparison. Be alert to two variations:
- A 100% DOD figure will look low next to competitors. It is actually the more conservative claim.
- A 90% DOD figure sits awkwardly between conventions and is sometimes used to inflate a number while appearing rigorous.
What to ask: “Is the cycle count at 80% DOD, and is that 80% of nominal capacity or 80% of usable capacity?” The second half of that question catches a subtle trick: if a pack’s BMS already reserves 10% at each end, “80% DOD” of the remaining window is not the same as 80% of nameplate.
3. Charge and discharge rate — 0.2C, 0.5C or 1C?
C-rate is the current expressed as a multiple of capacity. A 280Ah cell cycled at 0.2C is being charged and discharged at 56A; at 1C it is 280A.
Higher rates generate more internal heat and increase polarisation, both of which accelerate capacity fade. Many favourable cycle life figures are produced at 0.2C or 0.5C, while the product is marketed for applications that will regularly see higher rates.
What to ask: “What C-rate was used, and does the cycle life figure hold at the product’s rated continuous discharge current?”
This check matters most for commercial and industrial systems doing two cycles a day, and for backup applications with high-inrush loads such as compressors and pumps.
4. End-of-life threshold — 80% or 70% capacity retention?
As shown in the table above, this one variable alone can shift a headline number by thousands of cycles.
80% retention is the mainstream convention for stationary storage and the one most warranties are written against. 70% retention produces a bigger number and is increasingly seen on datasheets where no standard is cited.
What to ask: “At what capacity retention percentage is end of life defined, and does your warranty use the same threshold as your datasheet?”
That second clause is important. A datasheet claiming 8,000 cycles to 70% alongside a warranty guaranteeing 70% retention at year ten is internally consistent. A datasheet claiming 8,000 cycles to 70% alongside a warranty promising 80% retention is not, and you should raise it.
5. Cell-level or pack-level testing?
This is the check that separates cell traders from system manufacturers.
A cycle life figure measured on a single cell in a temperature-controlled chamber is the theoretical ceiling. A complete pack will always perform below it, because:
- The weakest cell governs the pack. A 16S pack is limited by whichever cell hits the voltage limit first, not by the average.
- Thermal gradients exist inside a real enclosure. Cells in the centre of a pack run warmer than cells at the edges, and age faster.
- Balancing capability is finite. Passive balancing typically moves 50–200 mA. If cell divergence outpaces the balancer, usable capacity contracts faster than cell-level data predicts.
- Parallel strings drift. In a multi-unit installation, cabling resistance differences cause uneven current sharing.
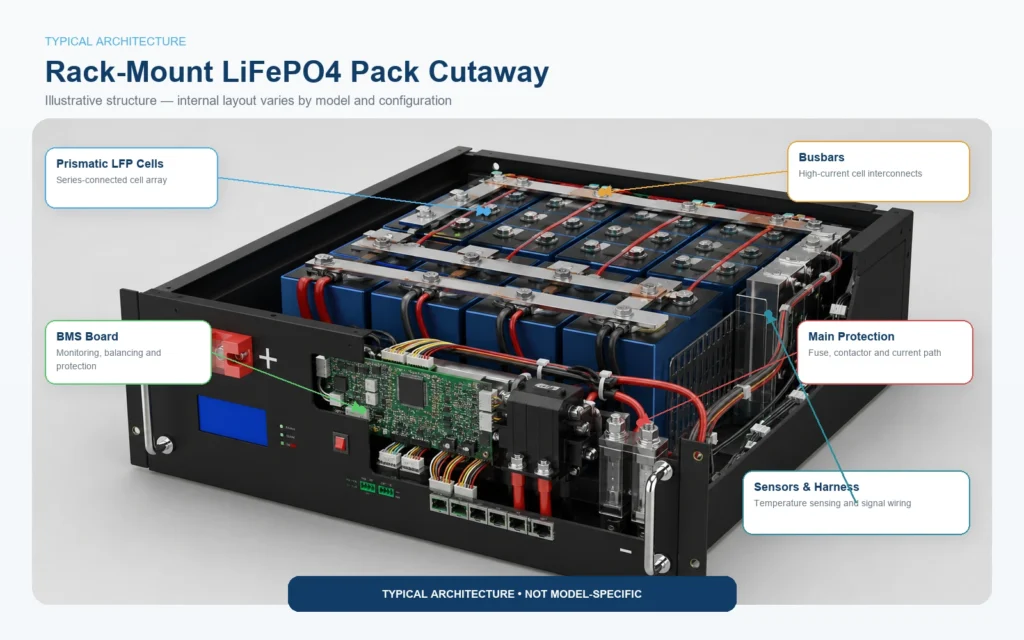
What to ask: “Is this cycle life figure from a cell datasheet or from a test on the assembled pack? If it is cell-level, what derating do you apply at pack level?”
A supplier who answers this cleanly — “cell-level 6,000 at 80% DOD/25°C, we specify 5,000 at pack level” — is demonstrating engineering discipline. A supplier who insists the pack number equals the cell number is either not testing packs, or not telling you.
[IMAGE: cutaway of a rack-mount pack showing cell arrangement and BMS position — alt: “Pack-level LiFePO4 battery cycle life is limited by the weakest cell and thermal gradients”]
6. Which standard was followed?
A cycle life number produced against a published standard is auditable. One produced against an internal procedure is not.
| Standard | Scope | Relevance |
|---|---|---|
| IEC 62620 | Performance requirements for secondary lithium cells and batteries in industrial applications | The mainstream reference for cycle life test methodology |
| IEC 62619 | Safety requirements for secondary lithium cells and batteries in industrial applications | Safety, not performance — but frequently cited alongside |
| IEC 63056 | Safety requirements for lithium batteries in energy storage systems | Builds on 62619, ESS-specific |
| GB/T 36276 | Lithium-ion battery for electrical energy storage (China) | Widely used by Chinese ESS manufacturers; defines cycle test conditions explicitly |
| UL 1973 | Batteries for stationary and light electric rail applications | North American market access; includes performance elements |
What to ask: “Which standard’s cycle test procedure was used, and can you share the test report?”
For more on how these standards interact with market access and shipping, see our companion guide to LiFePO4 battery certifications.
7. Does the report name your exact model?
The last check is the most practical, and the one most often skipped.
A cycle life test report is only evidence for the configuration it was run on. A report covering a 51.2V 100Ah wall-mounted pack does not automatically cover a 51.2V 280Ah rack-mounted pack, even if both use cells from the same supplier — different cell format, different thermal path, different BMS parameters, different result.
What to ask: “Does the report name the exact model I am buying, the exact cell model inside it, and the cell manufacturer?”
If the answer is evasive on cell manufacturer, that is a signal in itself. A manufacturer with a stable supply relationship will name the cell supplier. A trader buying whatever grade is cheapest that quarter usually will not, because the answer changes.
Cycle Life vs Calendar Life: Which Limits Your Project First?
Here is the calculation almost nobody runs before signing a purchase order, and it changes how much cycle life is actually worth paying for.
Lithium iron phosphate cells age in two independent ways. Cycle ageing is driven by throughput. Calendar ageing happens regardless of use, driven by time, temperature and average state of charge. A typical stationary LFP system carries a design life of 10–15 years on calendar grounds alone.
Now convert cycles into years:
| Application | Cycles/day | 6,000 cycles = | 8,000 cycles = | 10,000 cycles = |
|---|---|---|---|---|
| Residential solar self-consumption | 1 | 16.4 years | 21.9 years | 27.4 years |
| Residential + backup, active market | 1.5 | 11.0 years | 14.6 years | 18.3 years |
| C&I peak shaving, two-cycle tariff | 2 | 8.2 years | 11.0 years | 13.7 years |
| Aggressive C&I / arbitrage | 2.5 | 6.6 years | 8.8 years | 11.0 years |
Read across the residential row. At one cycle per day, a 6,000-cycle rating already outruns the 10–15 year calendar life of the hardware. Paying a premium to move from 6,000 to 10,000 cycles in a one-cycle-per-day residential application buys years the battery will never reach. Calendar ageing, enclosure corrosion, BMS component life and inverter replacement will end the system first.
Now read the C&I rows. At two cycles per day, cycle life and calendar life converge — and above two cycles per day, cycle life becomes the binding constraint. This is where a genuine 8,000-cycle rating is worth paying for, and where an inflated one will cost the project owner real money.
The practical conclusion: match the specification to the duty cycle. Do not let a supplier sell a residential customer on a cycle count that the calendar will never let them use, and do not let a C&I project be specified on a residential-grade assumption.
How to Read a LiFePO4 Battery Cycle Life Test Report
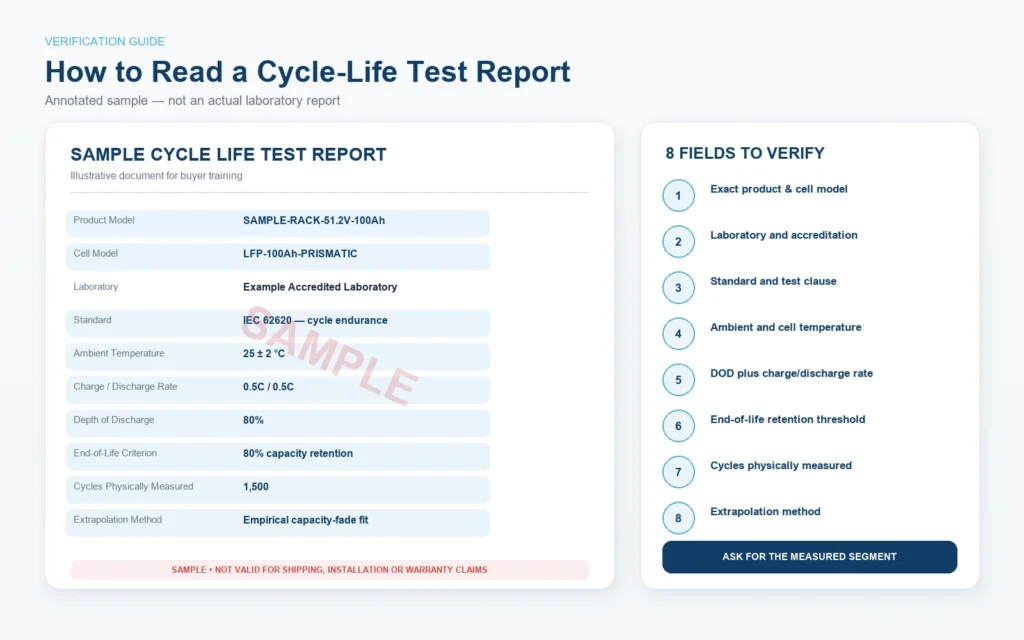
When a test report arrives, work through it in this order. A complete report answers all eight questions on the first two pages.
- Which model? Product model number and cell model number, both explicit.
- Which lab? Third-party laboratory name and accreditation, or clearly marked as an in-house test.
- Which standard? Named standard and clause, not “internal procedure”.
- Temperature? Ambient, and ideally cell surface temperature logged.
- DOD and C-rate? Charge rate and discharge rate stated separately — they are often different.
- End-of-life criterion? The retention percentage.
- How many cycles were actually run? This is the question that reveals the most.
- What model was used to extrapolate the rest? Linear, square-root-of-time, or a fitted empirical model.
On point seven: nobody has physically run 8,000 cycles on a current-generation cell. At one cycle per day that would take 22 years. Even under accelerated testing at 2–3 cycles per day, 8,000 cycles takes 7–11 years — longer than most cell models have existed. Every high cycle count in this industry is an extrapolation from partial data, typically 500 to 2,000 real cycles, projected forward with a fade model.
That is not dishonest. It is how the industry has to work. What separates a credible supplier from an unreliable one is whether they will tell you that and show you the real measured segment. A supplier who says “we ran 1,500 cycles, measured 96.2% retention, and extrapolate to 6,000 at 80%” is being straight with you. A supplier who presents 8,000 as a measured fact is either misinformed about their own data or is hoping you will not ask.
[IMAGE: annotated sample test report page highlighting the eight fields — alt: “How to read a LiFePO4 battery cycle life test report and verify test conditions”]
Building a Comparable Quote Sheet
Send this table to every supplier on your shortlist and ask them to complete it for the exact model they are quoting. The suppliers who complete it fully are the ones worth negotiating with.
| Field | Supplier A | Supplier B | Supplier C |
|---|---|---|---|
| Product model | |||
| Cell model and manufacturer | |||
| Cycle life claimed | |||
| Test temperature (°C) | |||
| Depth of discharge (%) | |||
| Charge rate (C) | |||
| Discharge rate (C) | |||
| End-of-life threshold (%) | |||
| Cell-level or pack-level | |||
| Standard referenced | |||
| Cycles physically measured | |||
| Warranty term (years) | |||
| Warranty throughput (MWh, if stated) |
That last row is the most useful commercial question you can ask. A warranty expressed as “10 years or X MWh throughput, whichever comes first” is a supplier putting a number behind the cycle life claim. A warranty expressed only in years, with no throughput limit and no retention threshold, is a supplier who has left themselves room to argue later.
Working With SafeCloud Power
SafeCloud Power manufactures LiFePO4 energy storage systems for distributors, solar installers, EPC contractors and OEM/ODM partners. On cycle life specifically, we work the way this article recommends:
- Cycle life figures are quoted with full test conditions on every datasheet — temperature, DOD, charge and discharge rate, and end-of-life threshold on the same line as the number.
- We state cell model and cell manufacturer for every product.
- Where a figure is extrapolated, we say so and provide the measured segment.
- We publish pack-level figures, not cell-level figures relabelled as pack performance.
If you are comparing quotes and need a like-for-like normalisation against another supplier’s numbers, send us the competing datasheet along with your duty cycle — cycles per day, ambient temperature range, and typical discharge current — and we will map both onto the same test envelope so you can compare them properly.
Request a datasheet with full test conditions →
FAQ
How many cycles does a LiFePO4 battery really last?
Between roughly 3,500 and 10,000, depending entirely on how it is used and how end of life is defined. For stationary storage cycled once daily at 80% depth of discharge and moderate temperature, 5,000–6,000 cycles to 80% capacity retention is a realistic pack-level expectation from a well-built system.
Is 8,000 cycles for a LiFePO4 battery realistic?
It is realistic as a cell-level figure at 25°C, 80% DOD, low C-rate, with end of life defined at 80% retention — and it will always be an extrapolation rather than a measured result. At pack level, in a real enclosure, at real operating temperatures, expect less. Ask which of those conditions applies before accepting the number.
Does depth of discharge really affect LiFePO4 battery cycle life that much?
Yes. Moving from 100% DOD to 80% DOD typically increases cycle count by roughly 50–70%; moving to 50% DOD can double it again. This is why oversizing a battery slightly and cycling it shallower often produces a lower lifetime cost per kWh delivered than buying the smallest system that meets the daily requirement.
What temperature is best for LiFePO4 battery cycle life?
Around 20–25°C for both cycling and storage. Sustained operation above 40°C accelerates capacity fade substantially. Charging below 0°C is a separate and more serious issue — it risks lithium plating and permanent damage, which is why a properly specified BMS blocks low-temperature charging rather than derating it.
Why do two suppliers quote different cycle life for the same cell?
Almost always because they are quoting different test conditions, or because one is quoting cell-level data and the other pack-level. Occasionally it is because they are using different cell grades from the same manufacturer. Ask both for the test conditions and the cell model, and the discrepancy usually explains itself.
Should I choose a battery based on cycle life alone?
No. Match cycle life to your duty cycle first — as the table above shows, extra cycles are worthless if calendar life ends the system first. Then weigh warranty terms, inverter compatibility, certification for your destination market, serviceability, and the supplier’s willingness to document what they claim.
SafeCloud designs and manufactures LiFePO4 energy storage systems for residential, commercial and project applications, with OEM/ODM support for global partners. For inverter compatibility, capacity sizing or a documented cycle life comparison against another supplier’s quote, send us your project parameters.